This brief text aims to highlight some of the most common economic indicators used to assess the economic performance of aquaculture production, both from the point of view of the industry as a whole, and from the point of view of aquaculture companies*.
In economics, there is no consensus on which indicator would best determine the economic performance of a sector or company. Indeed, there are used several indicators depending on what is the focus of interest (e.g. the society or the companies) and data availability. Different indicators are usually used or combined depending on the object of analysis. The same profitability indicator used to analyse the economic performance of the investments made, is not suitable to study the economic performance for the owners of the company.
In order to show the main indicators in a simple and clear way, we have divided the text into three sections. Firstly, we describe some of the main indicators used to analyse the economic situation at industry level. Next, we highlight the importance of the relative indicators as a tool to develop comparisons between different countries, production systems or types of companies. Finally, although all the indicators mentioned in the two first sections are also used in the economic analyses at company level, we dedicate the third section to explain other relative indicators that are very important when analysing the economic performance of aquaculture companies.
Analysis of economic performance at sector level
The Gross Value Added (GVA) measures the value of goods and services produced in an area, company or sector of an economy. It measures the contribution of the sector (or company) to the economy in terms of Gross Domestic Product (GDP). Thus, it refers to a notion that the wide public is already familiar. Following the methodology used in the STECF’s reports (STECF 2016, 2018) on the Economic performance of the EU aquaculture sector, GVA is estimated as:
GVA = Turnover + Other income – Feed costs – Livestock costs – Energy costs – Repair and maintenance – Other operational costs.
Net Value Added (NVA) measures the net contribution to the economy, free of the depreciation of capital. It is obtained by deducting depreciation costs (i.e., consumption of fixed capital) from the GVA. Even if it may have a stronger economic sense that GVA, it is less used.
NVA = Turnover + Other income – Feed costs – Livestock costs – Energy costs – Repair and maintenance – Other operational costs – Depreciation of capital. Or, NVA = GVA – Depreciation of capital.
Earnings Before Interest and Tax (EBIT) or “Operating profit” is a measure of the profitability that excludes interest and income tax expenses. It represents the profits obtained by the activity carried out, independently of how the investments have been financed, or of the taxation of the place where the company is located.
EBIT = Turnover + Other income + Subsidies – Wages and salaries – Imputed value of unpaid labour – Feed costs – Livestock costs – Energy costs – Repair and maintenance – Other operational costs – Depreciation of capital. Or, EBIT = NVA + Subsidies – Wages and salaries – Imputed value of unpaid labour.
Another measure of profitability is Net Profit, which represents the economic result after consider all the cost related with the activity. Usually, this indicator considers financial cost and taxes. So this result is affected by the financial strategy of the company and by the tax system. However, when the analysis includes industries or companies from different countries, the different taxation would include a bias in the analysis. In this context, net profit does not consider taxes. This is the case of the STECF’s reports on the Economic performance of the EU aquaculture sector, in which Net profit is estimated as:
Net profit = Turnover + Other income + Subsidies – Wages and salaries – Imputed value of unpaid labour – Feed costs – Livestock costs – Energy costs – Repair and maintenance – Other operational costs – Depreciation of capital – Financial costs net. Or, Net profit = EBIT – Financial costs net.
Please note that in aquaculture economics we consider important to account the imputed value of unpaid labour as a cost. Imputed value of unpaid labour is the opportunity cost of the work done by unpaid workers. Unpaid workers refer to persons who normally live with the proprietor of the unit and work regularly for the unit, but do not have a contract of service and do not receive a fixed sum for the work they perform. This is limited to persons who are not included on the payroll of another unit as their principal occupation. Thus, imputed value of unpaid labour estimates the value of the salaries that these unpaid workers would have received if their work was remunerated. By accounting for the Imputed value of unpaid labour, we avoid the appearance of extraordinary profits due to not remunerating the workforce. For the EU’s seabass and seabream sector, the value of imputed value of unpaid labour is negligible. But for other aquaculture segments, such as mussel and clam farming, this cost item is very important.
In the case of industry level analyses, we also consider that it is often not relevant to account for the financial costs and the extraordinary costs when analysing a sector as a whole, because they are not part of the normal production activities of the sector. Instead, including them makes more sense when looking at the economic performance of a particular company.
Relative economic performance indicators
In order to compare the economic performance of different agents (e.g. companies, sectors), it is recommended to put the previous indicators as a function of total income or turnover (usually expressed as a percentage). The Gross value added to revenue ratio indicates the share of revenue that contributes to the economy through factors of production (returns to labour and returns to capital). Indicator is calculated as the ratio between gross value added and revenue (the sum of Turnover and Other Income).
GVA to Revenue = GVA / (Turnover + Other Income)
Similarly, the Net value added to revenue ratio is estimated as:
NVA to Revenue = NVA / (Turnover + Other Income).
EBIT margin is estimated as a share of the Total income (Turnover + Other income + Operating Subsidies):
EBIT margin = EBIT / Total Income.
Net profit margin is a measure of the economic performance of a sector or enterprise expressed in relative terms. It is a difference between total income and all incurred costs (operating, capital and financial).
Net profit margin = Net profit / Total Income.
Often, these four indicators follow the same trend overtime, but at different levels (see Figure 1). GVA and NVA to revenue offer a picture of the importance of the sector to the whole economy; while EBIT and Net profit margin show how well the companies, in an aggregated form, are doing. The difference between GVA and NVA to revenue is driven by the relevance of the depreciation costs. The difference between NVA to revenue and EBIT margin is driven by the relevance of the workforce remuneration. While, the difference between EBIT and Net profit margin is driven by the relevance of the financial costs.
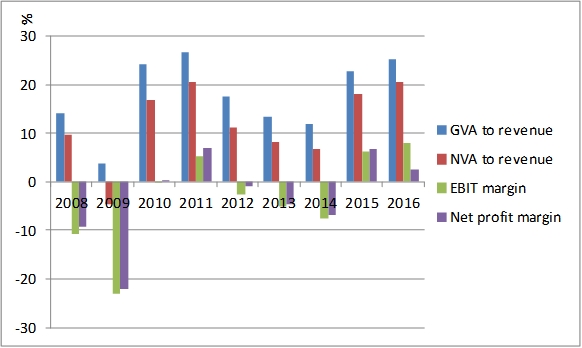
From Figure 1 it can be seen than the seabream and seabass sector in the EU was suffering economic losses and its contribution to the economy was rather low. Instead, in 2015 and 2016 economic performance indicators are all positive, showing the existence of profits in the sector and a positive contribution to the economy.
In fact, when looking at the economic performance of a sector or of a company, it is of extreme importance to look at the evolution of the costs, by comparing them overtime, with the average of the sector or with some targets.
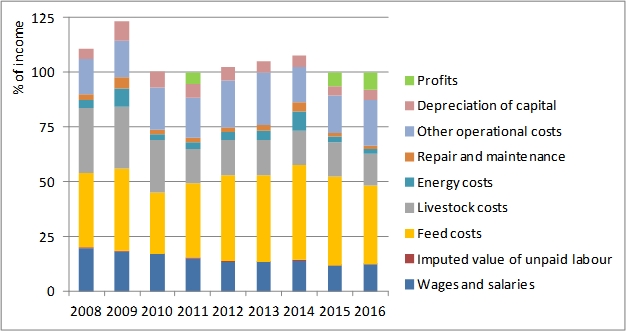
From Figure 2, when costs are higher than 100% (i.e., in 2008, 2009, 2012, 2013 and 2014), then the sector is suffering economic losses; while when costs are below 100%, then profits are registered (green surface in Figure 2).
Feed cost is the major cost item, in 2016 it reached 46% of the total costs; while fingerlings costs decrease to 14%. Other operational costs and wages account for 19% and 13% of the total cost, respectively. Other operational costs vary between 15% and 20%. Labour costs present a decreasing trend since 2008, this is in part explained by the decreasing wages and salaries in southern EU countries but also to the outsourcing of some activities in the sector. Energy cost are relatively low (2% in 2016), and their evolution depends on fuel prices.
Another important issue is to see the composition of the Total income. In particular, the share of Turnover, Other income and Operating Subsidies in the Total income.
Total income = Turnover + Other income +Operating Subsidies.
According to STECF (2018) data, operating subsidies for the EU’s seabass and seabream aquaculture sector have been around 2% of the total income, other income between 5 and 7%, and turnover (i.e., total gross sales) represented more than 90% of the total income during the period 2008-2016.
Analysis of economic performance at company level
Finally, when economic performance is analysed at company level, there are other indicators that become relevant and that are widely used not only in aquaculture, but commonly in the rest of economic activities.
The indicators described below are relative measures of the economic performance of a company that facilitate its analysis and comparison with aspects so fundamental and diverse such as the company objectives, other companies’ performance and the evolution over time.
In terms of economic performance, it is common to calculate several indicators based on the information available in the company’s annual accounts. Here the unit of analyses is the enterprise, without possibility of differentiate by facilities or species. The most widespread indicator are the “Return on Assets” (ROA) and “Return on Equity” ROE.
The ROA is calculated by dividing the EBIT by the total assets of the company. The result is the return obtained by the investments made, regardless of how they have been financed or of the taxation. This indicator allows knowing if the activity that the company is developing is profitable or not.
ROA = EBIT / Total assets.
The ROE is calculated by dividing the net profit between the equity, the own resources contributed by the owners of the company. In this way, it is obtained an indicator of the profitability that the owners obtain for the investment they have made. This performance measure is affected not only by the result of the productive and commercial activity of the company, but also by the financial structure and by taxation.
ROE = Net Profit / Equity.
This variety of indicators is sometimes a disadvantage in terms of comparability of data and results. However, it provides at the same time flexibility to economists, who, depending on the object of analysis and the available information, can approximate the analysis of economic performance through different measures.
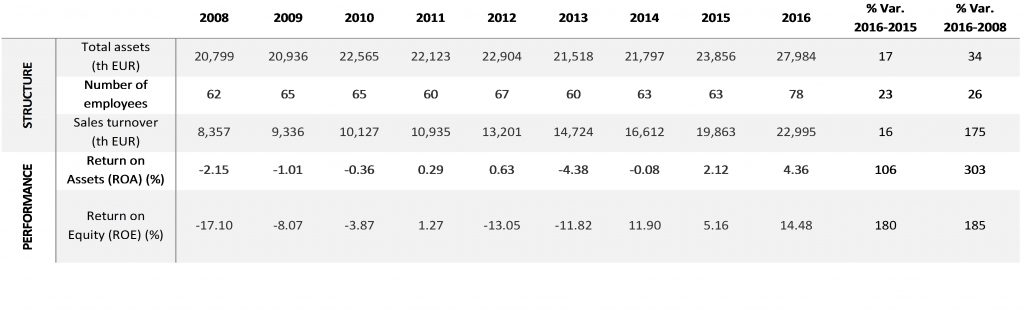
Table 1 provides a picture of the recent evolution of the economic performance in seabream and seabass companies. Considering the information of the companies included in the Assessment of Mediterranean Aquaculture Sustainability (MedAID, 2018), the average performance has followed a positive trend in the period 2008-2016. After a period in which both investments and equity obtained negative economic returns, in recent years, and in particular in 2015 and 2016, seabream and seabass companies have returned in average to positive economic results. In fact, since 2013 ROA and ROE increased from negative to positive. In spite of the continuous rise in the price of raw materials during the period analysed in Table 1, the decrease in the supply of seabream and seabass, and the consequent increase in market price, contributed to the improvement of the companies’ economic results. During 2015 and 2016, production increased. The greater demand of the markets absorbed the increases of production and this in turn kept prices stable. As a result, economic results continued to grow.
Trade data in 2017 and 2018 showed increases in the exports of the main producers, which seems to confirm that production continues to increase. At the same time, the industry’s efforts to grow in new markets, as well as economic recovery in traditional markets, have allowed to continue absorbing production increases. However, export prices during 2017 indicated that the price of seabream and seabass begins to adjust downward by the increased supply.
Economic outlook for seabream and seabass industry
Nowadays, there is a growing concern of possible price drops due to new increases in the volume of production. The context in which the industry faces the increase in production and the possible fall in prices is not the same as that of 2009 in terms of competitiveness. The companies have made efforts in innovation and improvement of production efficiency. Likewise, progress has been made in the development of new markets and products.
Despite the improvement in economic results in recent years, the industry competitiveness has room for improvements. The economies of scale have a limit and oversupply has shown to generate instability in the markets and to negatively impact the economic results in the medium-long term. In this context, the multidisciplinary and integrated approach of the MedAID project is the adequate to contribute to the improvement of the competitiveness of the industry at a time that seems to be vital to its economic sustainability.
On the one hand, the project can help companies to improve their production efficiency through technical, operational and management innovations. It is especially important that these improvements have a real impact on production activity. The reduction of the average cost of production is a key aspect for the sustainability of the activity. The improvement of economic margins would make profitability less dependent on the volume of production, thus helping to avoid supply increases that result in price drops.
On the side of commercialisation, the diversification of products and markets could help to reduce the risk associated with fluctuations in supply and prices. In this sense, EU producers can consider new markets and differentiation as alternatives to price competition. The latter can be addressed in several ways, from the communication of the highest quality about the product, to innovation in processing and packaging. Diversification is more efficient as the size of the company increases. Differentiation is a key aspect for the competitiveness of small-medium size companies/industries whose scale of production is not sufficiently large to compete in prices or diversify to a large number of markets or products.
*: “The opinions expressed in this text are those of the author and do not necessarily reflect the European Commission’s positions or policy”.
![]() Complete article with references
Complete article with references
Authors:
|
|
Jordi Guillén |
|
|
Ignacio Llorente |