Fisheries and aquaculture are managed under the EU’s Common Fisheries Policy (CFP)
Managing the exploitation of fish and shellfish stocks in European marine waters falls under the European Union (EU)’s Common Fisheries Policy (CFP), which was formally established in 1983 (Council of the European Communities, 1983), and has since undergone reforms in 1992, 2002, and 2013 (EU, 2013). The scope of the CFP extends to joint conservation, management and exploitation of living aquatic resources by EU member states, with the objective of biological, economic and social sustainability.
The CFP requires considering scientific advice (based on Dörner et al., 2018)
The Directorate-General for Maritime Affairs and Fisheries (DG MARE – (https://ec.europa.eu/maritimeaffairs) is the European Commission’s department responsible for implementation of the CFP. The CFP explicitly requires the European Commission to take ‘into account available scientific, technical and economic advice’ (EU, 2013) when drafting legislative proposals for the European Parliament and Council. Accordingly, European Commission proposals relating to fisheries management must be based on scientific advice. Hence implementation of the CFP requires both the assistance of specialised experts and the availability of high-quality data and analyses. The European Commission’s own expert scientific independent advisory body on fisheries and aquaculture is the Scientific, Technical and Economic Committee for Fisheries (STECF – https://stecf.jrc.ec.europa.eu/index.html). The STECF is being consulted at regular intervals on matters pertaining to the conservation and management of living aquatic resources, including biological, economic, environmental, social and technical considerations (European Commission, 2016). The European Commission’s Joint Research Centre (JRC) also has a role in the scientific advisory process by providing advice directly to DG MARE, through participation in the STECF and its Expert Working Groups (EWGs).
Scientific advice requires high-quality data (based on Dörner et al., 2018)
The provision of advice for fisheries management under the CFP is dependent on the collection and availability of high-quality data, which are collected and owned by the EU member states under the provisions of the EU-wide data framework for the collection of fisheries data (Data Collection Framework – DCF).
The implementation of the 2nd EU Data Collection Framework Regulation (DCF) in 2009 was essential to further improve the access, exchange, and utility of EU data for scientific advice for fisheries management purposes (EU 2008, European Commission 2008, 2009). Data collection has been co-financed by the member states and the European Commission. With the DCF in place, the JRC started to develop and maintain databases to store time series of economic data for the EU fishing fleet, aquaculture and fish processing sectors, biological and transversal data (capacity, effort, and landings) for the evaluation of fishing effort management regimes, and biological, transversal and survey data for Mediterranean and Black Sea fish stock assessments. The JRC also started to make the data used by the STECF and its EWGs publicly available in aggregated form as electronic annexes to STECF reports (https://stecf.jrc.ec.europa.eu/reports) and through online dissemination platforms (https://stecf.jrc.ec.europa.eu/data-dissemination), which facilitate interactive data exploration and downloading by anybody potentially interested. Nowadays, DG MARE, academia, industry, national administrations, and non-governmental organizations (NGOs) frequently use STECF reports and the dissemination platforms.
STECF reports on the economic performance of the EU aquaculture sector
Thus, under the DCF, EU member states are required to collect data on the aquaculture sector. In most EU member states, data for the aquaculture sector are collected via surveys conducted by national statistical offices or other agencies or institutes. In 2011, STECF analysed DCF economic data on the EU aquaculture sector for the first time, while the 2018 report (STECF, 2018) was the sixth and latest of its kind. The 2018 report on the economic performance of the EU aquaculture sector (https://stecf.jrc.ec.europa.eu/reports/economic) constitutes the most recent comprehensive overview of the information available on the production, economic value, structure and competitive performance of the aquaculture sector at the national and EU level. In particular, the aquaculture economic reports provide information on the structure (number of enterprises, employment), production in weight and value, raw materials, and economic data (income, costs, capital value and investment) of the companies whose main activity is aquaculture production. Data are segmented by the main species produced (salmon, trout, seabream and seabass, mussels, etc.) and the main technique (cages, hatcheries, etc.). Because providing data on the freshwater aquaculture sector is optional under the DCF (and landlocked countries do not participate), not all EU member states provided data regarding their full national aquaculture sectors, so the reported DCF data were supplemented using production data held by the statistical office of the EU (Eurostat) and the Food and Agriculture Organization of the United Nations (FAO) to provide a more complete overview of the aquaculture sector for all 28 EU member states.
Results from the 2018 report on the economic performance of the EU aquaculture sector
Results from the latest STECF aquaculture report (STECF, 2018) show that even if aquaculture production has been stagnant, the turnover and economic performance indicators have increased over time. The EU aquaculture sector reached 1.4 million tonnes in sales volume and €4.9 billion in sales value, in 2016.
The EU aquaculture sector can be divided into three main sectors: Marine, Shellfish and Freshwater production. The marine sector is the most important economically and generated the largest turnover of €2 731 million, followed by the shellfish sector with €1 134 million and the freshwater sector with €1 028 million. EU aquaculture production is mainly concentrated in 5 countries: Spain (21%), France (15%), Italy (14%), the United Kingdom (14%), and Greece (10%), making up 74% of the sales volume. These 5 countries are furthermore covering 73% of the sales value in EU28.
The total number of enterprises in EU is estimated to be 12 500. Almost 90% of the enterprises in the aquaculture sector are micro-enterprises, employing less than 10 employees. The number of employees in EU was estimated to be 75 300 in 2016. The number of Full-Time Equivalent (FTE) was estimated to be 43 680, which might indicate a tendency towards higher specialization and less part-time employment in the sector, because the ration between employees and FTE has been decreasing. However, the use of part time labour still contributes significantly to the workforce in the EU aquaculture sector. The average yearly wage was €25 000, corresponding to a 7% increase compared to 2014.
The seabream and seabass aquaculture sector in the EU
The evolution of the European seabass and gilthead seabream aquaculture production and prices present a similar picture, as companies often produce both species. Global prices of farmed European seabass and gilthead seabream achieved their minimum level in 2001 and 2002, due mainly to major production increases from 2000. Average global ex-farm prices for farmed European seabass and gilthead seabream fell from around $15 per kg (about $30 in real terms) in early 1990s to around $4 per kg (about $5.5 in real terms) in 2002, stabilizing later at around $6 per kg (Figure 1). Farmed European seabass and gilthead seabream prices often fell below production costs, causing major crises in the sector and resulting in a rationalisation of the industry (Rad and Köksal, 2000; University of Stirling, 2004; Rad, 2007; Wagner and Young, 2009; STECF, 2014). The number of companies in the seabream and seabass sector is reducing, and so production is concentrating in fewer companies. Theoretically, this should lead to economies of scale, reductions in average costs, and increases in productivity, as has happen in other more mature aquaculture segments, such as the salmon industry (Asche & Bjorndal, 2011).
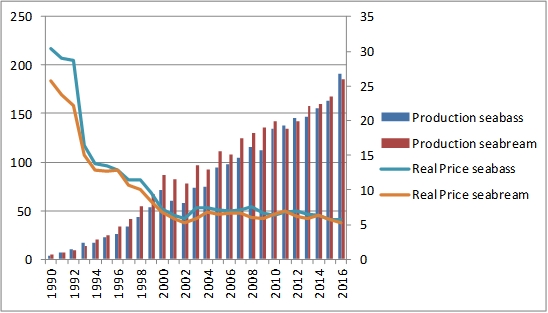
According to FAO aquaculture production data, the volume share of the EU producer countries of European seabass and gilthead seabream has decreased from 60% in 2008 to 44% in 2016. Accordingly, the value share of the EU producer countries has decreased from 65% in 2008 to 51% in 2016 (FAO, 2018).
Based on submitted data, in the study period (2008-2016) the EU seabass and seabream sector grew in terms of production and employment. The EU seabass and seabream sector, according to the submitted data consists of 154 enterprises (Greece not included), which is an increase from the 2015, but the trend for the period 2008-2016 shows an overall reduction. Most of these firms combine the production of the two species, and volumes of each may change yearly according to the demand and prices. Employment reached 5 759 employees corresponding to 4 667 FTEs in 2016. On average the wages in the EU seabass and seabream aquaculture segment slightly decreased.
The turnover from the EU seabream and seabass production reached €1 007 million in 2016, mainly originating from the cages segment. The EU seabass and seabream presented operating costs higher than the turnover for 2013 and 2014, and therefore generated losses. However, due to market stabilization, turnover in 2015 has for the first time since 2010 exceeded the total operating costs.
In 2016, raw material (feed costs and fingerlings) account for 60% of the total cost. Feed costs share increased to 46% and fingerlings costs decrease to 14%. Other operational costs and wages account for 19% and 13% of the total cost, respectively. Other operational costs vary between 15% and 20% since 2008 while wages and salaries present a decreasing trend. Part of the decreasing trend may be attributed to the decreasing wages and salaries in the southern EU countries but also to the outsourcing of some activities in the segment. After increase from 1% in 2008 to 7% in 2014 reflecting the increasing fuel prices for the period 2008 to 2014, the energy cost share decreased to 2% in 2016. Productivity shows an overall increase for the period 2008-2016, in part due to improvements in the economic performance (e.g. GVA). According to market reports, in the next reporting period, it is expected to realize improvements in production, processing, logistics and marketing that will help to boost company margins through demand generation and cost savings.
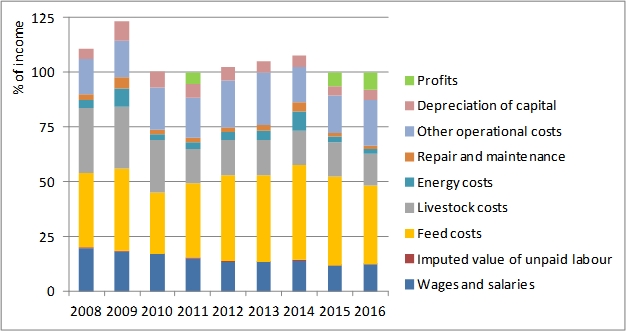
From Figure 2, when costs are higher than 100% (i.e., in 2008, 2009, 2012, 2013 and 2014), then the sector is suffering economic losses; while when costs are below 100%, then profits are registered (green surface in Figure 2).
The evolution of the markets during 2017 and 2018 will determine if the process of improving the economic results is consolidated or, on the contrary, the industry re-enters a negative context. The increase in supply, the behaviour of prices, and the ability of the industry to diversify products and markets and consolidate improvements in the production process will be the main determining factors of this evolution.
In addition, based on the EU’s National strategic plans for the development of aquaculture, as production is expected to grow in forthcoming years, there is a need to reduce dependency on domestic market sales and increase the export market penetration of these species. Also, the need for improved data collection and dissemination is being recognized, so as the need for better environmental regulations and practices. Although profitability in the reference period has been the major issue, some steps should be taken towards laying a more stable foundation and encouraging the sustained growth of the industry in the future.
![]() Complete article with references
Complete article with references
 Author:
Jordi Guillén
Project Officer – Water and Marine Resources Unit
European Commision – Joint Research Centre