The goal of MedAID is to increase the overall competitiveness and sustainability of the Mediterranean marine fish-farming sector throughout the whole value chain. In this context, the MedAID Project Work-package 6 (Improving business performance and development of strategic marketing plans), through the Task 6.5 “Estimation of the economic impact of improvements in production and marketing” aims to analyze the economic impact at the micro (firm/farm) level of some specific measures in the production and marketing areas to improve the financial performance of the European seabass and gilthead seabream aquaculture industry.
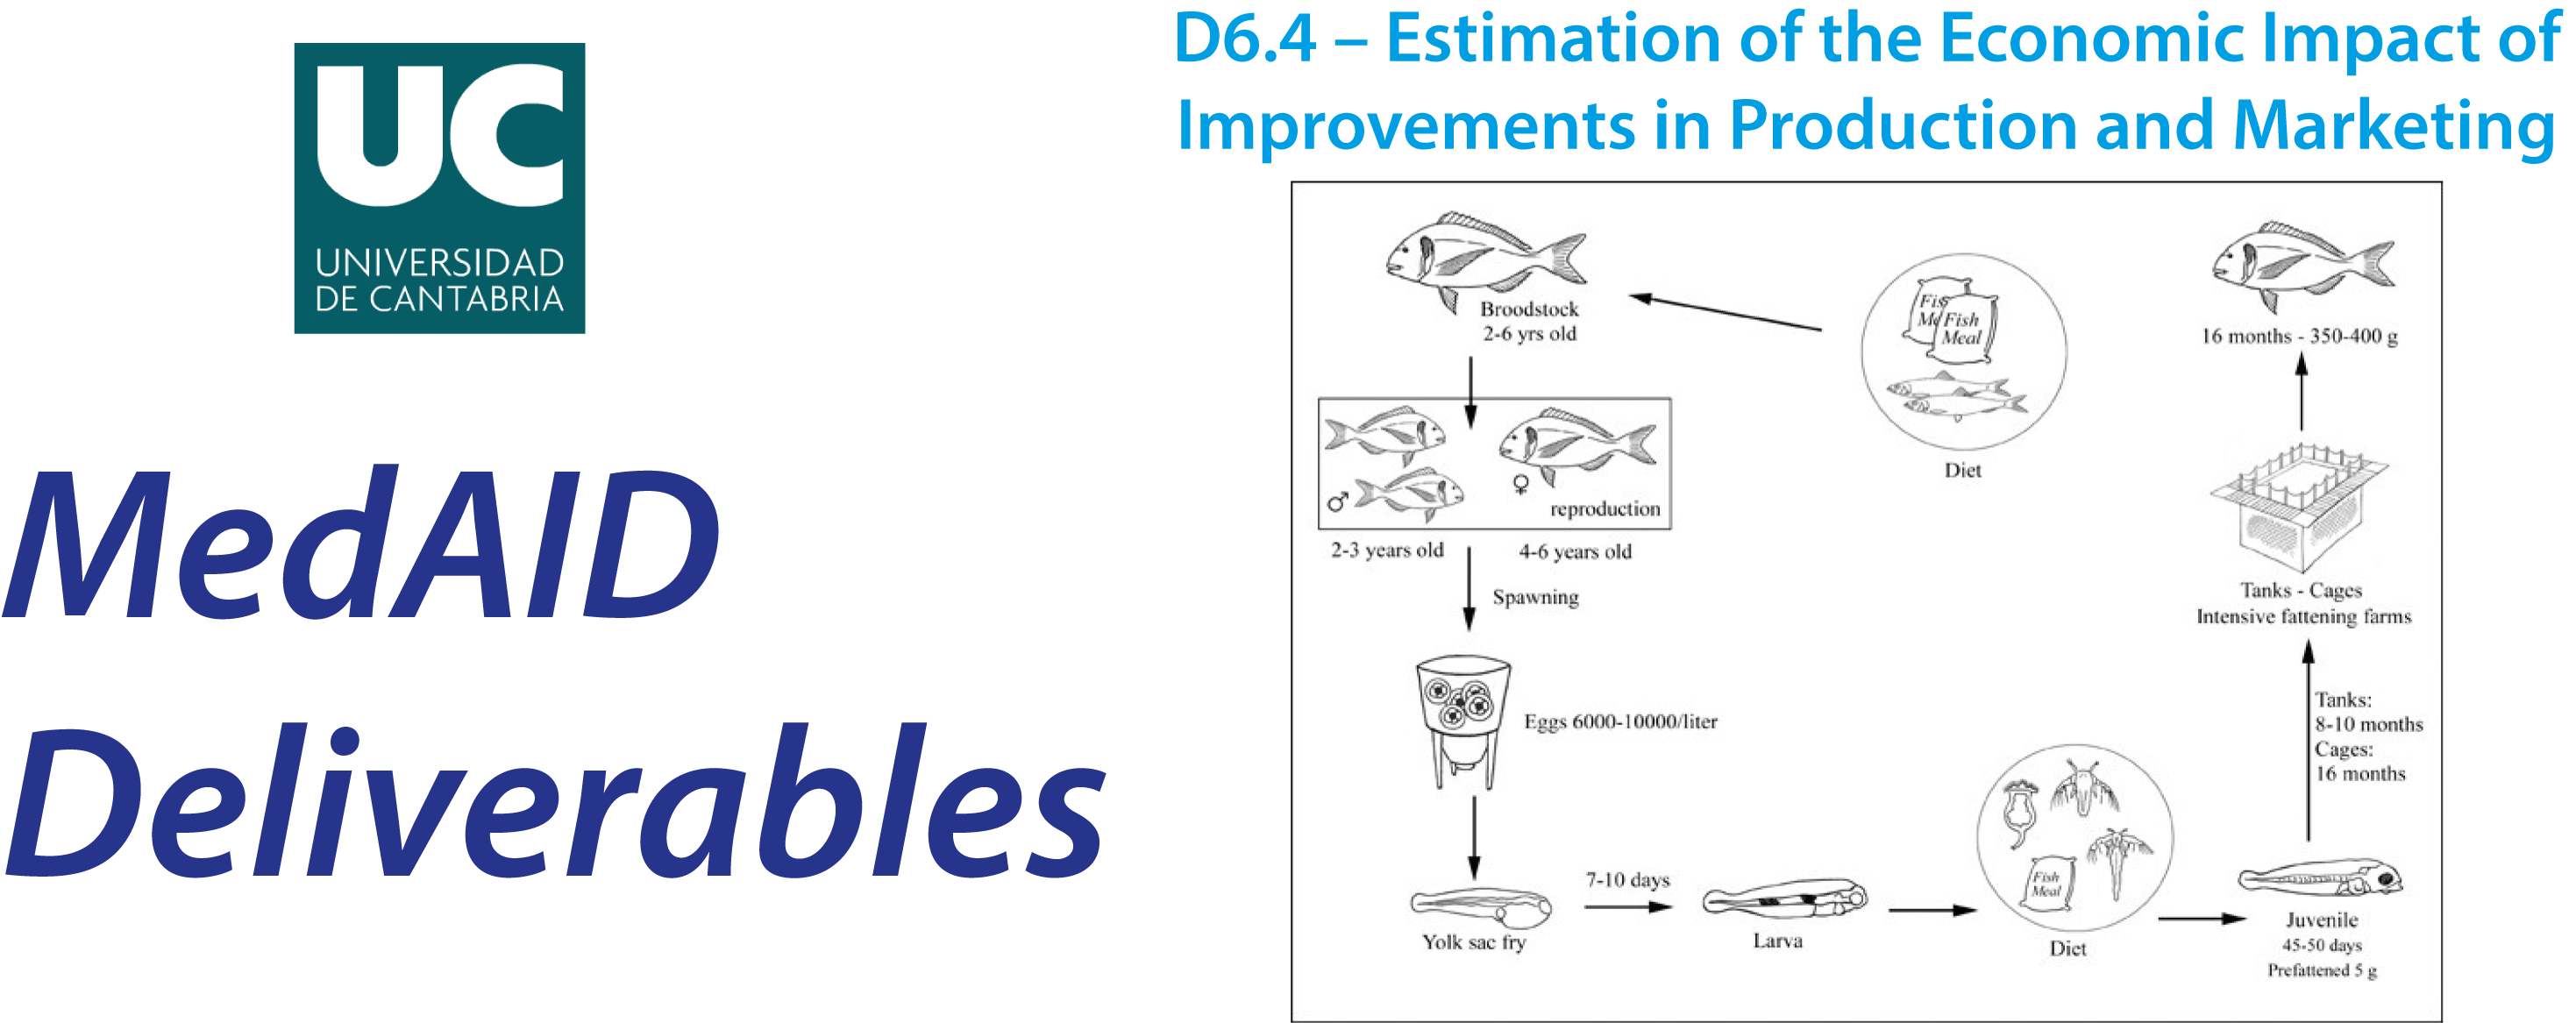
To carry out this analysis, we have designed a deterministic static model programmed with the spreadsheet Excel, which we have named MedAID Model for Economic Simulation (MMES), to simulate the annual income statement of an aquaculture facility (firm or farm). The model simulates in an independently way a grow-out facility for growing up seabass and seabream as well as a hatchery-nursery facility to culture seabass and seabream fry and larvae in the Mediterranean Sea. To obtain the baseline values of model parameters, we have used data from representative facilities from six European countries (Croatia, Cyprus, France, Greece, Italy, and Spain) collected in the survey conducted in MedAID’s WP1.
The operational parameters selected and analyzed with this model were the unit sales price, the survival rate, the harvested weight, the tank/cage density, the growth rate, the fingerling unit cost, the feed unit cost and the feed conversion ratio (FCR). To run the sensitivity analysis with the former operational parameters, four different production scenarios were designed:
• Scenario 1 (mean-sized hatchery). In this scenario we have analyzed the effects of changes in different model parameters for a mean-sized hatchery facility which produces about 10 million of indistinctly juveniles of seabass and/or seabream in an unspecific location of the Mediterranean Sea.
• Scenario 2 (mean-sized grow-out, seabass, one location). In this scenario we have analyzed the effects of changes in different model parameters for a mean-sized grow-out facility which produces about 650 tonnes of only adult-size seabass in an unspecific location of the Mediterranean Sea.
• Scenario 3 (medium-sized grow-out, seabass and/or seabream, one location). In this scenario we have analyzed the effects of changes in different model parameters for a medium-sized grow-out facility which produces about 1,270 tonnes of indistinctly adult-size seabass and/or seabream in an unspecific location of the Mediterranean Sea.
• Scenario 4 (mean-sized grow-out, seabass and/or seabream, Western Med). In this scenario we have analyzed the effects of changes in different model parameters for a mean-sized grow-out facility producing about 650 tonnes of indistinctly adult-size seabass and/or seabream in the Western Mediterranean Sea.
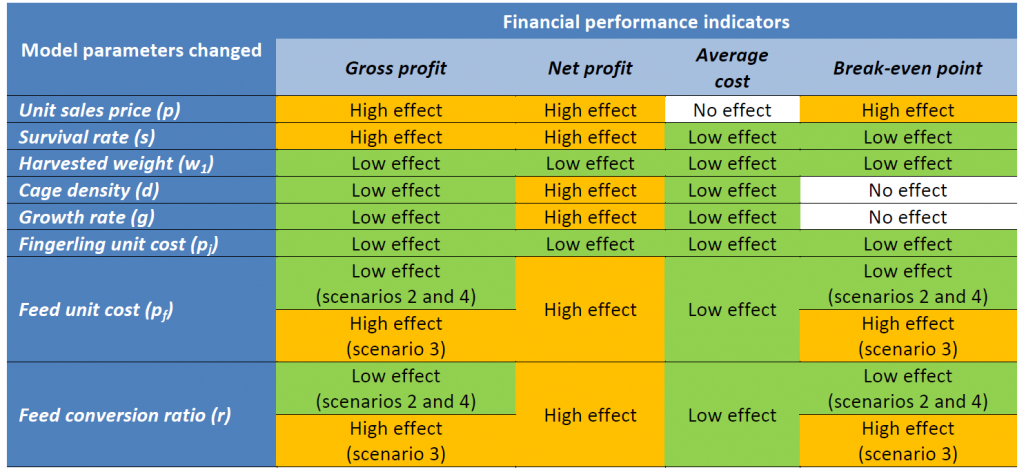
The economic impact of model parameters changes (sensitivity analysis) has shown that the unit sales price (p) is the model parameter with the largest impact on profits for all scenarios (i.e. hatcheries and grow-out facilities), followed by survival rate and harvested weight parameters in hatcheries and by survival rate, feed cost and FCR in grow-out facilities. On the other hand, the feed unit cost and feed conversion ratio are the model parameters with the lowest impact on profits of a hatchery facility (scenario 1), whereas the harvested weight and fingerling unit cost are the model parameters with the lowest impact on profits of a grow-out facility (scenarios 2, 3 and 4). All these effects have been briefly summarized in Table Ex1 for a standard hatchery facility (H) and Table Ex2 for a standard grow-out facility (G).
The use of this Economic Simulation Model could help seabass and seabream producers to better understand the extend of benefits on possible investments and zootechnical management improvements that can be implemented in their facilities, under different technical and market conditions.
Table Ex1. Impact of model parameters changes in hatchery facilities (Scenario 1)
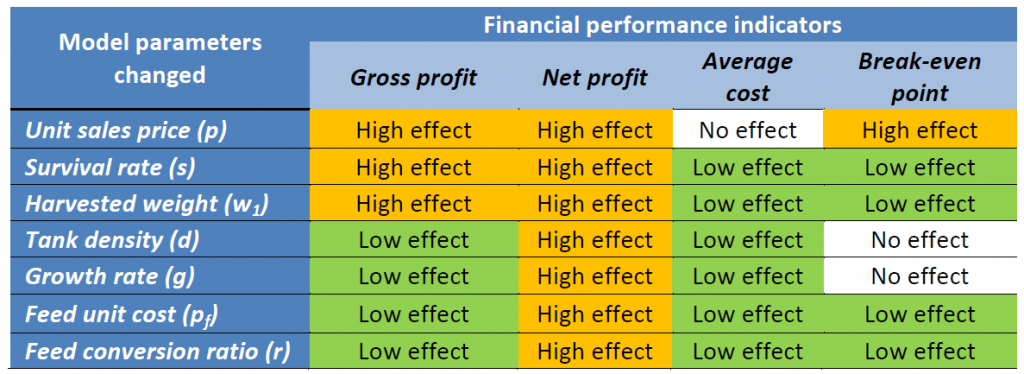
Table Ex2. Impact of model parameters changes in grow-out facilities (Scenarios 2, 3 and 4)
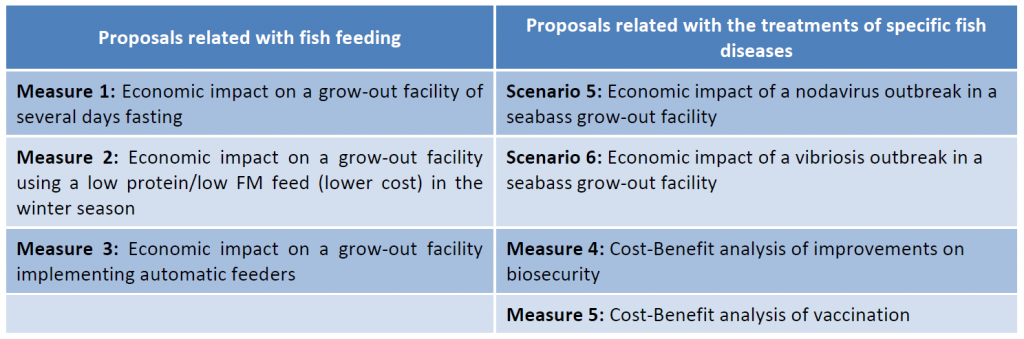
Finally, in the last section of this report it is explained the work in progress in connection with MedAID’s WP8, analyzing the economic impact on representative seabass and/or seabream grow-out facility of some specific measures/recommendations proposed by other work packages of this project (specifically with WP2-zootechnics and WP4-health management). This analysis is being done taking into account different assumptions and hypotheses regarding the farm size (micro, small, and medium farms) and production strategy (e.g., to produce fish of 450 grams, one kilo, or two kilos), so that different case scenarios are considered. Thus, according to the assumed parameters fixed for each case scenario, we will obtain baseline values of the variables employed to measure the facility’s financial performance of the different case scenarios proposed for this analysis. The assumptions and hypotheses to set up as well as the specific information to use in this work are being obtained from different professionals and experts on feed management and prevention and treatment of fish diseases. The different measures/recommendations derived from WP2 and WP4 to carry out this analysis are presented in Table Ex3.
Table Ex3. Relation of measures to evaluate their economic impact in connection with WP8
Access to the full deliverable